East L.A. residents map food and recreation resources
Community-engaged Mapping In Boyle Heights And East LA
In 2010, the Alliance for a Better Community (ABC), a policy organization established to respond to and shape Latino policy in Los Angeles, conducted a Community Health Assessment of Boyle Heights and East Los Angeles. As part of this assessment, ABC partnered with Healthy City to research and analyze the affect of the built environment on community health in the defined areas and propose policy goals to address identified concerns. Through Participatory Asset Mapping, ABC gathered first-hand knowledge from community members about local food and recreation/physical activity assets and resources and any issues surrounding access to them.
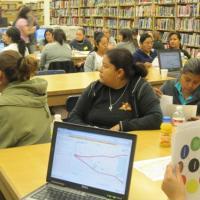
Community-Engaged Mapping in action.
During April and May 2010, ABC held eight Community-Engaged Mapping events throughout Boyle Heights and East Los Angeles, with over 240 youth and adult residents participating. These mapping events gathered knowledge from community residents on the quality of resources available to them and built environment issues that affected the accessibility of those resources. Residents were asked to identify the food and recreation locations that they did or did not frequent in their community. HealthyCity.org Live Mapping tool was used to document the locations of and information about the health and recreational assets in the community.
The agreed definition of a community asset confirmed with participants in each session was a positive place or program that makes the community a safe, healthy, and great place to live." Community members identified the resources that they frequented in their community, as well as places they knew of but did not frequent, for healthy food and physical activity. They also graded each resource they identified using the scale "A" through "F". They provided a brief description of why they gave each resource a particular grade (with an "A" grade representing an asset and an "F" grade representing a resource that was not an asset). For example, one resident graded a local park with a 'C' because of insufficient programming for older youth. Community members then identified specific physical and built environment issues around each resource to determine any barriers that kept them from using those resources.
Understanding community assets and context.
The identified community resources were sorted for each mapping session location and a two-mile radius to show the grade distribution of resources in each area. In addition, of the combined total number of resources identified in each session, those that received a grade of a "B" or below were scanned for a qualitative analysis of the descriptions representing each grade. Any description that mentioned concerns for safety around a particular resource was coded and mapped to visually display locations people perceived to be unsafe. The map of perceived unsafe places was then compared to the map of all identified environmental design issues to see if there is any relationship between the built environment and people’s perceptions of a place being unsafe.
Community residents gave many of the local food and physical activity resources a "B" or higher, deeming them assets to the community. Nearly 30% of all resources identified were places that residents avoided, usually because they felt unsafe. Residents commented that they typically visited multiple stores to meet all of their food needs, and, in some cases, these stores had quality meat but lacked fresh fruits and vegetables. Although 27% of residents regarded local parks as quality spaces, they often avoided them because of lack of programming and safety concerns.
Advocating for change.
ABC included results from community residents and the Participatory Asset Mapping events in its policy analysis and recommendations on community health in these communities. Findings supported policy recommendations to increase the availability and accessibility of quality food options and adequate physical activity spaces, and implementing measures to make existing resources safer for community members.Further information about its policy recommendations can be found ABC’s 2011 policy report Places, Spaces & People: How the Urban Environment Impacts Health in Boyle Heights and East Los Angeles.